Subtotal Calculations
Subtotals present data more conveniently when
large dimensions contain too much data to be shown in the crosstab.
A subtotal summarizes the measure based on the rules defined in the
data source or model. You can specify the number of items to show
in the crosstab.
The following table describes each subtotal.
| Subtotal | Description |
|---|---|
| Subtotal (visible) | The sum of the visible items, which is updated automatically as you change the data in the crosstab. |
| More More & Hidden |
The values of the remaining items beyond the specified number that still meet any filter criteria. More changes to More & Hidden if there are any hidden values. This subtotal is updated automatically as you change the data in the crosstab. |
| Total (included in the filter) | The sum of the subtotal of visible items and the More or More & Hidden subtotal. |
| Subtotal (Excluded) | The sum of values that are excluded, such as by being filtered out. |
| Summary | A grand total of all the previous subtotals. |
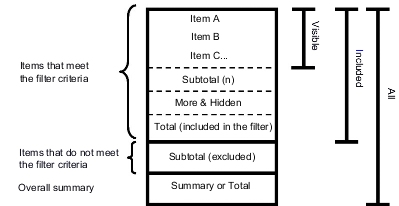
The following diagram shows how subtotals are broken down.