
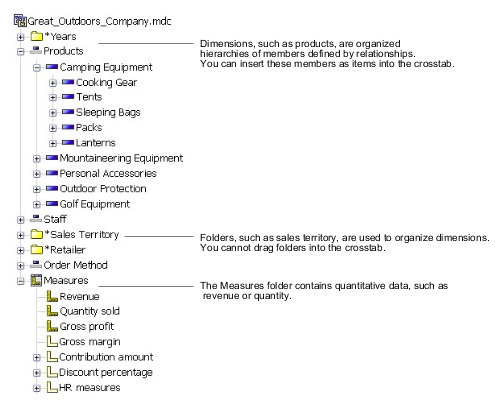
The Source Tree
The source tree presents a dimensional view of your data, organized into dimensions, hierarchies, levels, and measures.
The Measures folder contains quantitative data, such as revenue or quantity.
By default, the maximum number of items shown in the source tree is 50. Your administrator may set a different value for optimum performance, depending on the size of the data source.
The following is an example of a source tree.
Relative Time Hierarchies
When you open an analysis that contains the years 2005 and 2006 in the rows from the Years hierarchy, the crosstab simply compares the years 2005 and 2006.
In the source tree, the time dimension may also contain relative time hierarchies, such as Current Month, Last Month, QTD, Prior QTD, YTD, Prior YTD, and so on. Current Month contains the most recent month of data in the cube, and the other hierarchies are relative to Current Month.
For example, you insert Prior YTD into the rows, then nest YTD into the rows under Prior YTD. If the current month is December 2006, the analysis shows the results for January to December 2005 versus January to December 2006.
If you save the analysis and open it the following year, when the current month is June 2007, the analysis shows results for January to June 2006 versus January to June 2007. The results shown in your analysis change, relative to Current Month in the updated cube.
The administrator may alter the date ranges for these items, or create specific relative time items based on the needs of your organization.