Example - Create a Crosstab for an Analysis of Order Method Revenue
You are a business analyst at the Sample Outdoors
Company, which sells sporting equipment. You are asked to analyze
the consequences of discontinuing the fax and mail order methods,
which are expensive to process.
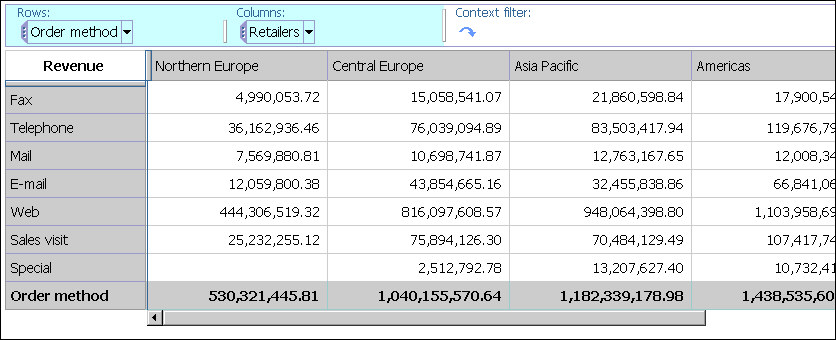
First you get the items you need and insert them into a crosstab for further analysis.
Before you can try this example, you must set up the sample packages that come with IBM® Cognos® Business Intelligence. For more information, see the IBM Cognos Business Intelligence Administration and Security Guide.
Procedure
- Click the Analysis Studio
 link.
link. IBM Cognos Analysis Studio opens, and data from the Sales and Marketing package appears in the source tree.
Results
You now have data to compare and analyze. Next, you can see if revenues for these methods are growing or declining.