Polar Charts
Polar charts are useful for showing scientific
data.
They are circular charts that use values and angles to show information as polar coordinates.
You can specify a default measure. For example, you might need to specify a default measure to give context to a calculated measure in the chart. For more information about the default measure, see Specify the Default Measure.
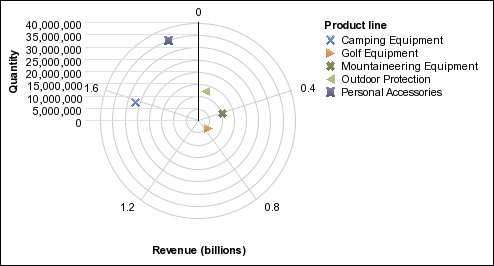
The following example shows the revenue and quantity for each product line. The distance along the radial axis represents quantity, and the angle around the polar axis represents revenue.