
Combination Charts
Combination charts plot multiple data series
by using combinations of columns, areas, and lines within one chart.
They are useful for highlighting relationships between the various
data series.
Note: The Quantity Sold vs. Shipped and Inventory sample report in the GO Data Warehouse (analysis) package includes a combination chart. For more information about the Sample Outdoors Company samples, see Sample Reports and Packages.
The following example shows a combination chart that includes planned revenue as a line chart and actual revenue as a column chart.
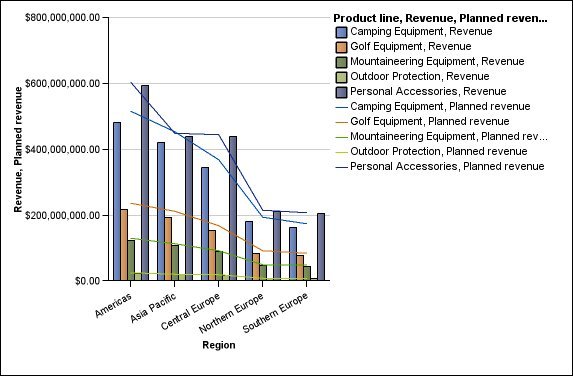
Combination charts can plot data using standard, stacked, 100 percent stacked, and three-dimensional configurations.