
Range Indicator Charts
Range indicator, or metrics range, charts are
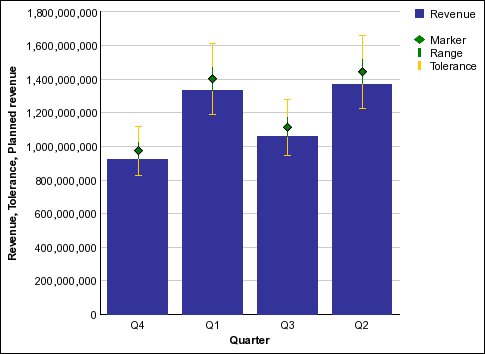
useful for showing a target range and a tolerance range.
A range indicator chart adds a target and range marker to a column, line, or area chart.
The following example shows actual revenue versus planned revenue. The markers indicate the planned revenue, and the range and tolerance lines are defined by the chart author.
You can also insert IBM® Cognos® Metric Studio diagrams in your report to show the relationship between metrics. For more information, see Add a Static Metric Studio Diagram to a Report and Add a Data-driven Metric Studio Diagram to a Report.