
Bar Charts
Bar charts are useful for showing trends over
time and plotting many data series.
Bar charts use horizontal data markers to compare individual values.
Note: The Manager Profile sample report Manager Profile in
the GO Data Warehouse (analysis) package includes a bar chart. For
more information about The Sample Outdoors Company samples, see Sample Reports and Packages.
The following example shows revenue for every country or region.
Figure 1. Bar chart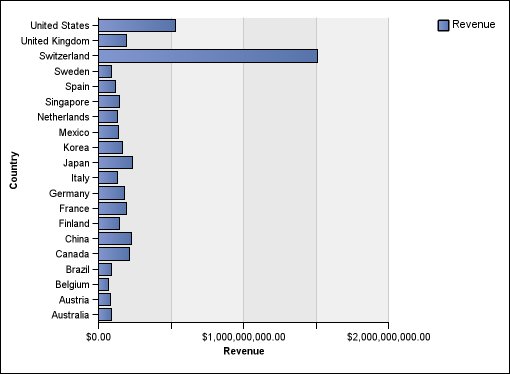
Bar charts can plot data using standard, stacked, and 100 percent stacked configurations.