
Column Charts
Column charts are useful for comparing discrete
data or showing trends over time.
Column charts use vertical data markers to compare individual values.
Note: The Sales Growth Year Over Year sample report Sales Growth Year Over Year in the GO Data Warehouse (analysis)
package includes a column chart. For more information about The Sample
Outdoors Company samples, see Sample Reports and Packages.
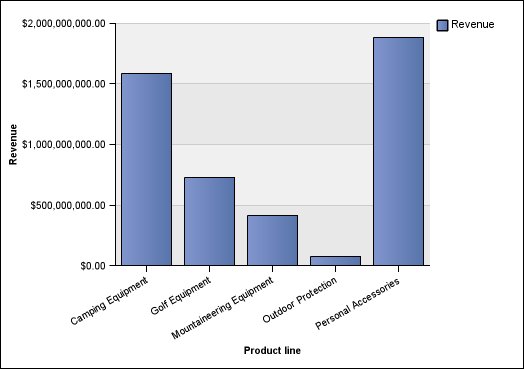
The following example shows the revenue for each product line.
Column charts can plot data using standard, stacked, 100 percent stacked, and three-dimensional configurations.