Microcharts
Microcharts are smaller versions of column charts,
bar charts, and line charts that you can use in crosstabs and dashboards.
Microcharts include column microcharts and bar microcharts, which
are available in stacked and 100 percent stacked configurations, and
win-loss charts and modified line charts that contain the following:
- A closing value marker.
- Opening, closing, high, and low value markers.
- A reference line.
Note: If you specify custom labels for a microchart, the custom labels
appear in the tooltips, not on the chart itself. For more information
about custom labels, see Specify Custom Label Text.
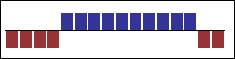
Win-loss charts are microcharts in which the value of each column is either 1 or -1, often denoting a win or loss.
Win-loss charts use two measures (the default and the win-loss measure) and no series. The win-loss measure is the measure or calculation that you define. You can also specify a default measure. For example, you might need to specify a default measure to give context to a calculated measure in the chart. For more information about the default measure, see Specify the Default Measure.
The following example shows the quarters that have a margin of less than 10,000 in red.