Example - Add a Conditional Style to an Existing Report

You are a report writer at The Sample Outdoors 
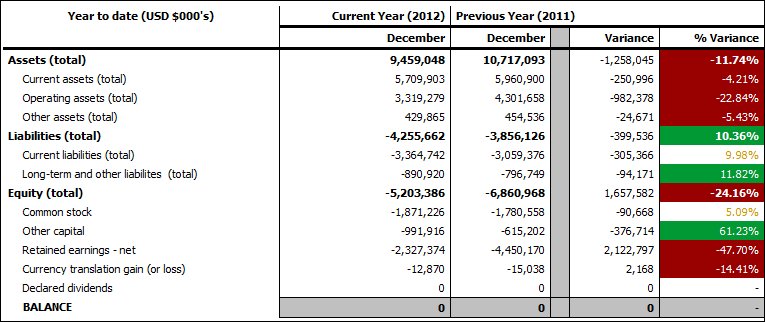
Company, which sells sporting equipment. You have a report that compares current year data to previous year data and highlights negative percentage variances in red (Poor) and positive percentage variances in green (Excellent). You want to add a third conditional style to indicate percentage variances above 0 but less than 10. You create a conditional style that highlights percentage variances between 0 and 10% in yellow (Average).

Procedure

  1. Open the GO Balance Sheet as at Dec 31 2012 report from the GO Data Warehouse (analysis) package.
  2. Right-click any cell in the % Variance column and click Style, Conditional Styles.
  3. Select Conditional Style 1 and click the edit button edit icon.
  4. Select the first advanced condition listed and click the edit button.
  5. Delete =0 from the expression definition.
  6. Click the Functions tab, and then expand the Operators folder.
  7. Double-click between, and then click after between in the expression, add a space, and type 0.
  8. Double-click and, and then click after and in the expression, add a space, type .1, and click OK.
  9. From the Style box associated with this condition, click Average.
  10. Select the second advanced condition listed and click the edit button.
  11. Replace >0 in the expression with >.1 and click OK.
  12. Leave the style associated with this condition as is.
  13. Run the report.

    The new conditional style appears in the % Variance column.

    Figure 1. Conditional styles that are applied to a report
    the final crosstab showing assets, liabilities, and equity for the current and previous years with a colored percent variance column