Change the Axis Scale of a Current Default Chart

By default, IBM® Cognos® Report Studio automatically determines the minimum and maximum scale values for the axes in a chart. For example, a Y-axis showing revenue values might have an axis range of zero dollars to one million dollars. You can customize the axis scale, or range, to make your chart easier to understand.

You can specify the following for each axis:

  • the maximum and minimum values of the range
  • whether to include zero in an automatic axis range
  • whether to use a logarithmic scale, if the values in the chart cover a very large range
  • how often major and minor gridlines appear

Logarithmic scales can be useful when some of the data you are displaying is much less or much more than the rest of the data or when the percentage or ratio differences between values are important.

A logarithmic scale in Report Studio shows the base value of 10 raised to the power of a value. For example, 10 has a logarithm of 1 because 10 raised to the power of 1 is 10, 100 has a logarithm of 2 because 10 raised to the power of 2 is 100, and so on.

For example, the following chart is using a normal scale:

Figure 1. Chart with a normal axis range
a bar chart showing revenue by product line using a normal scale with an axis range of 0.00 to 100 million

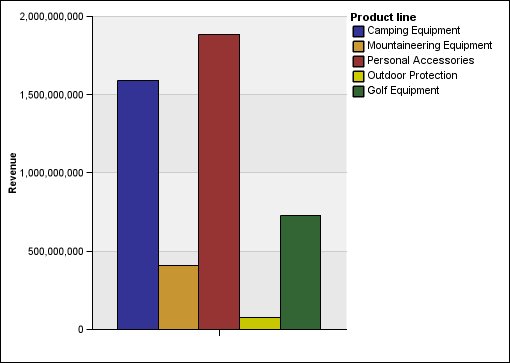
In this chart, the Y-axis shows values up to 2,000,000,000 with evenly spaced intervals of 400,000,000. However, the Outdoor Protection column is so much less than the other columns that it is difficult to compare them.

The following is the same chart using a logarithmic scale:

Figure 2. Chart with a logarithmic axis range
a bar chart showing revenue by product line using a logarithmic scale with an axis range of 1 million to 100 million

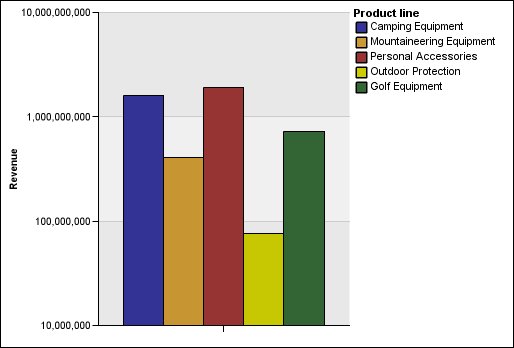
In this chart, the Y-axis still shows the same revenue values, but the intervals reflect a logarithmic scale, which increases exponentially. You can now compare all the product lines because none of the product lines have much higher or much lower values than the others.

Logarithmic scales can also be useful when the percentage or ratio differences between values are important. For example, if the logarithmic scale chart above represents data from 2011, and you add data from 2012 as a second set of colored bars, you could see the differences between the 2011 revenue and 2012 revenue. In a logarithmic scale, differences between values on the Y-axis represent the same percentage for each bar. So if the 2011 and 2012 data differs by the same distance for each product line, you could deduce that your revenue went up by the same percentage for each product line. This would not be clear on a normal scale.

Procedure

  1. Select the Y-axis or the X-axis of the chart.
  2. In the Properties pane, under General, double-click the Axis Range property.
  3. To set a maximum value for this axis, under Maximum, click Manual, and then type a maximum value in the Manual box.
    Note: You can use either a positive or negative value as the maximum value.
  4. To set a minimum value for this axis, under Minimum, click Manual, and then type a minimum value in the Manual box.
    Note: You can use either a positive or negative value as the minimum value.
  5. To include zero on this axis, select the Include zero check box.
  6. To use a logarithmic scale for this axis, select the Logarithmic scale check box.
    Note: If you choose to use a logarithmic scale, ensure that your chart consumers know that the scale is logarithmic by including that information in the axis title or in a note on the chart.
  7. To set the position of major gridlines and tick marks, under Major interval, click Manual, and then type the distance between major gridlines and tick marks in the Manual box.

    The distance between major gridlines and tick marks is measured in the units of that axis. For example, if the axis is revenue in dollars, type the dollar value in the Manual box.

  8. To add minor gridlines, type the number of minor gridlines that you want to see between each major gridline in the Number of minor intervals box.