You are a report author at The Sample Outdoors
Company, which sells sporting equipment. You are asked to show how
revenue for the company is distributed throughout the world. This
information can be shown in tabular format using a list report, but
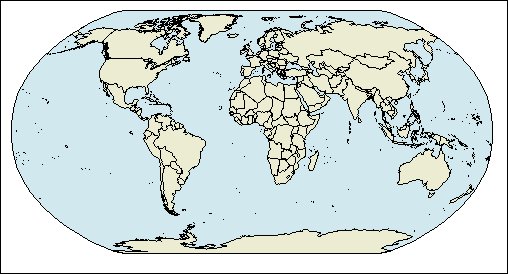
a map will create a more meaningful presentation. You decide to create
a report that contains a map of the world showing the distribution
of revenue by country and region.
Procedure
- Open IBM® Cognos® Report Studio with the GO
Data Warehouse (query) package.
- In the Welcome dialog box, click Create
a new report or template.
- In the New dialog box, click Map and
click OK.
- In the Choose Map dialog box, in
the Maps pane, expand the World folder
and click World.
- In the Region layers box, click Countries
and Regions + Territories.
- In the Point layers box, click None.
- In the Display layers box, click Oceans.
Tip: You can select or deselect multiple display
layers by Ctrl+clicking.
Tip: You can return to
the Choose Map dialog box at any time by double-clicking
the map background.
- Drag the following data items to the map:
- Revenue (in Sales fact)
to the Color drop zone.
- Retailer country and region (in Retailer
site) to the Location drop zone.
- Run the report.