Customize the Chart Legend Labels
This example has three parts: creating the metrics
range chart, customizing it, and customizing the legend labels.
Procedure
- Under the chart legend select Marker.
- In the Properties pane, under Text Source, double-click the Text property.
- Replace the text in the Text dialog box with Planned revenue and click OK.
- Under the chart legend select Tolerance.
- In the Properties pane, under Text Source, double-click the Text property.
- Replace the text in the Text dialog box with Tolerance: 10% of planned revenue and click OK.
- Under the chart legend, select Range.
- In the Properties pane, under Text Source, double-click the Text property.
- Replace the text in the Text dialog box with Planned revenue range = 50% and click OK.
- Run the report.
Results
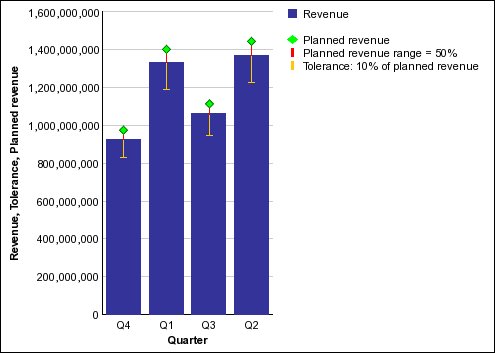
The report now shows customized legend labels for the markers, tolerances, and ranges as shown in the following chart.
Figure 1. Metrics range chart with customized legend labels for the markers,
tolerances, and ranges