Example - Define Data Values for the Region Layer
The map that you created in the previous topic
is not yet linked to a data source. You will now specify the data
values from your data source that will determine the color of each
region.
Procedure
- From the Source tab
 , expand Sales and Marketing (query), Sales (query), and Sales fact.
 - Drag Revenue to the Color drop zone.
- Expand Employee by organization.
- Drag Country or Region to the Location drop zone.
- Run the report.
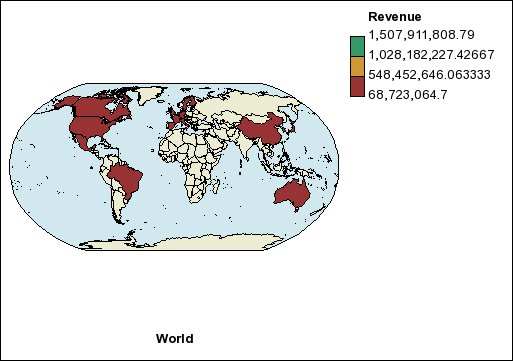
Results
Figure 1. Map showing revenue by country
or region