Scatter Charts
Scatter charts use data points to plot two measures
anywhere along a scale, not only at regular tick marks.
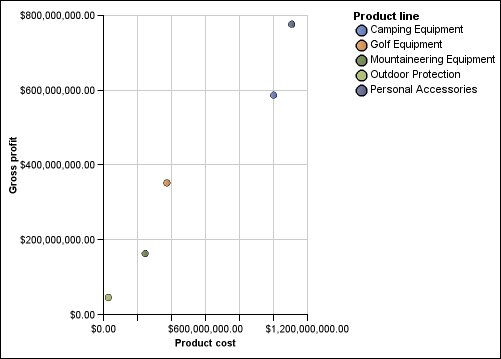
Scatter charts are useful for exploring correlations between different sets of data.
The following example shows the correlation between production cost and gross profit for each product line.
Figure 1. An example scatter chart