
Bullet Charts
Bullet charts are a variation of bar charts.
They compare a featured measure (the bullet) to a targeted measure
(the target). They also relate the compared measures against colored
regions in the background that provide additional qualitative measurements,
such as good, satisfactory, and poor.
Bullet charts are often used instead of gauge charts in executive dashboards. Bullet charts can be horizontal or vertical.
Note: This chart type applies only to the current default
charts, and does not apply to the legacy charts.
The following figure is an example of a bullet chart.
Figure 1. An example bullet chart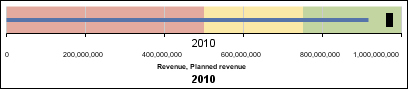
A bullet chart contains the following components:
- A bullet measure.
The bullet measure, Revenue, appears as the blue bar in the example.
- A target measure.
The target measure, Planned revenue, appears as the black indicator in the example.
- From zero to five colored regions along the numeric scale to provide
information about the featured measures' qualitative state.
The example contains three colored regions, 0-50%, 50-75%, and 75-100%.
- A label that identifies the measures.
- A numeric scale.