Progressive Column Charts
Progressive column charts, also knows as waterfall
charts, are like stacked charts with each segment of a single stack
displaced vertically from the next segment.
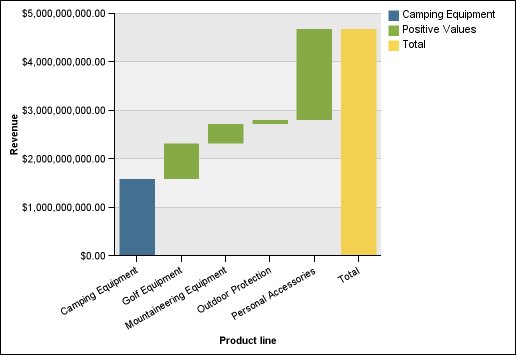
Progressive column charts are useful for emphasizing the contribution of the individual segments to the whole.
These charts are not supported for Microsoft Excel output.
The following example analyzes the contribution of each product line to revenue.
Figure 1. An example progressive column chart