Marimekko Charts
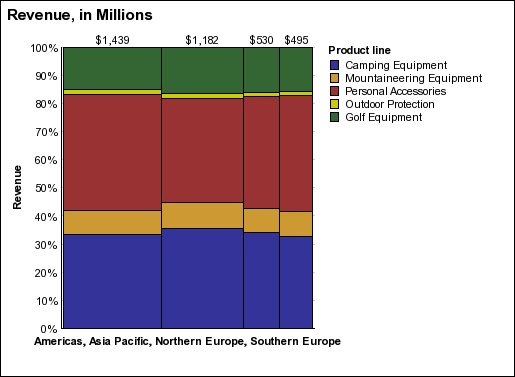
Marimekko charts are 100 percent stacked charts
in which the width of a column is proportional to the total of the
column's values. Individual segment height is a percentage of the
respective column total value.
The following example shows the contribution of revenues for product lines in different regions.
Figure 1. An example Marimekko chart