Point Charts
Point charts are useful for showing quantitative
data in an uncluttered fashion.
Point charts use multiple points to plot data along an ordinal axis. A point chart the same as a line chart without the lines. Only the data points are shown.
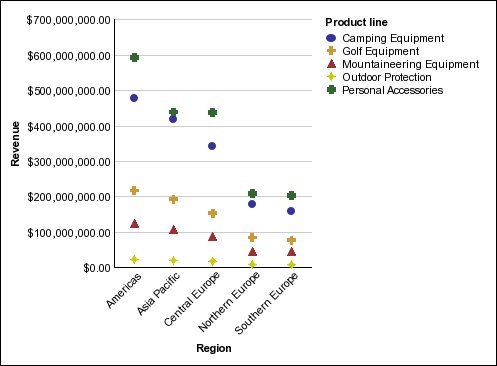
The following example shows the revenue for each product line.
Figure 1. An example point chart