You can customize the gauge border, axes, lines,
pivot, and needle to make the chart easier to read.
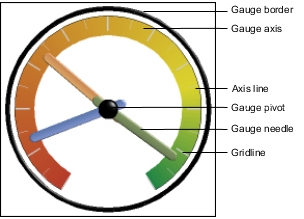
Figure 1. The
elements of a gauge chart
Unless indicated in the user interface, all sizes are a
percentage of the maximum allowed.
If your gauge chart includes
a border, long axis labels, such as 250,000,000, might overlap the
gauge border and be difficult to read. To avoid this problem, customize
the data format of your gauge chart measure and reduce the scale so
that fewer zeros are displayed. Or change the gauge border color or
size or remove the border.
Procedure
- Click the gauge chart object.
- If you want to change the size, shape, and color of the
center pivot point, in the Properties pane,
click Gauge pivot, and specify the style.
- If you want to customize the border around the gauge, in
the Properties pane, click Gauge
border.
- If you want to change the indicators in the gauge axis,
select the gauge axis object in the chart and do the following steps:
- To customize the gauge needles, in the Properties pane,
click Gauge needle and specify the style
- To change, add, or remove color bands that indicate the data range
positions, in the Properties pane, click Gauge
axis colors and specify the color palette.
- To change the gridlines, in the Properties pane,
click Gridlines or Minor gridlines and
specify the style.
- To change the appearance of the gauge axis line, click Axis
line and specify the style.