You use IBM® Cognos® for Microsoft Office to access IBM Cognos content in Microsoft Excel
spreadsheet software. In Excel, you can work with and add value to
existing IBM Cognos reports, apply calculations, and use
your existing Microsoft Excel macros. When you reconnect to the IBM Cognos server, you can refresh the data to obtain the latest information.
You can also import content into Microsoft PowerPoint and Microsoft Word.
IBM Cognos security is maintained
in your Microsoft Office
environment. For example, if you share a Microsoft Excel workbook with coworkers,
when they connect to the IBM Cognos server to retrieve
or refresh data, their security permissions retrieve the appropriate
data.
This exercise shows how to
- Import IBM Cognos content into a Microsoft Excel workbook
- Refresh data
- Publish a workbook to IBM Cognos Connection
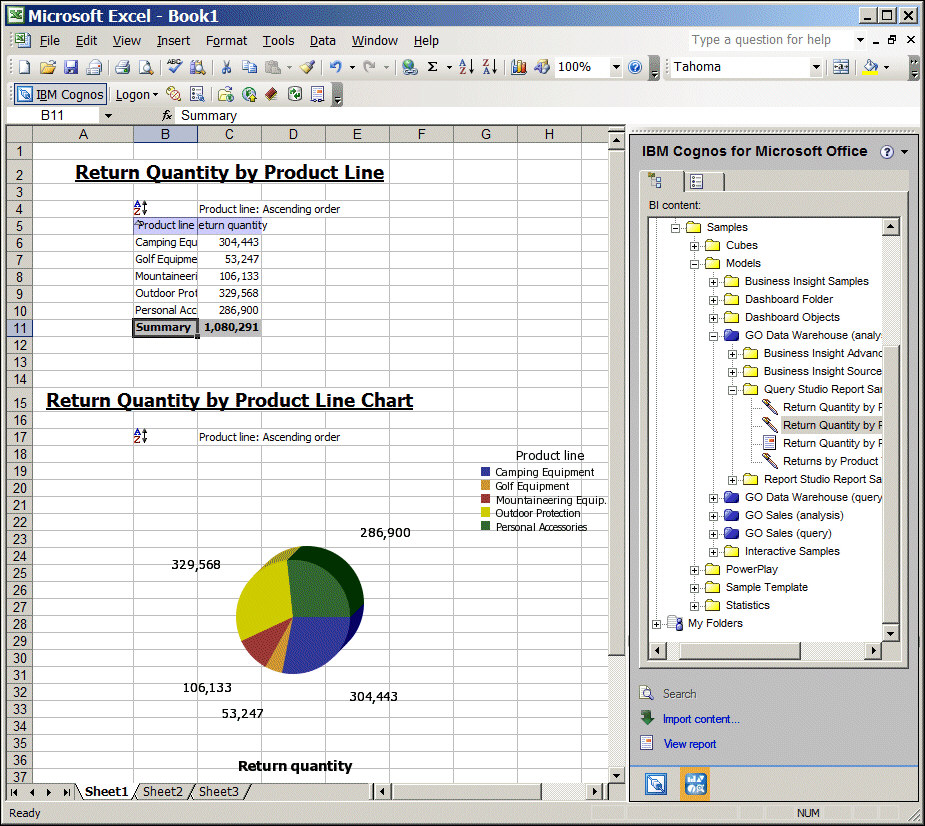
You want to import the information from the two IBM Cognos Query Studio sample reports named Return Quantity by
Product Line and Return Quantity by Product
Line Chart into Microsoft Excel.
To perform this exercise, you must have
the appropriate licensing and security permissions. IBM Cognos for Microsoft Office
as well as the .NET framework must be installed and configured on
your computer.
Things to notice:
- You use IBM Cognos for Microsoft Office to import IBM Cognos report elements,
such as headers, footers, images, lists, and charts in your Microsoft Excel workbook. You
can import elements from different reports into the same workbook.
- When you save your workbook, you can save it with or without data.
- You can publish workbooks to IBM Cognos Connection
so that other users can access them.
Procedure
- Start Microsoft Excel. The IBM Cognos for Microsoft Office pane appears.
- To begin using IBM Cognos for Microsoft Office, on the toolbar, click
the Logon icon, select the server that you
want to connect to, type your user ID and password, and click OK.
- Import the sample reports Return Quantity by
Product Line and Return Quantity by Product
Line Chart in the workbook:
- In the IBM Cognos for Microsoft Office pane, click the Browse Content tab.
- Expand Public Folders, Samples, Models, GO
Data Warehouse (analysis), Query Studio Report
Samples, and click Returns Quantity by Product
Line.
- Click Import content.
In the Import Content window, you can
select the specific report elements that you want to import. You want
to keep the default selections.
- Click Finish.
- Repeat the steps for the Return Quantity
by Product Line Chart report.
The
reports appear in the workbook.
- Refresh the data in the report:
- In the IBM Cognos for Microsoft Office pane, click the Manage Data tab. In the Imported report elements box, you can see all the elements in your workbook and their properties.
- Right-click the report and click Refresh
Data and Formatting.
Because the sample
database is static, the report contents do not actually change.
- Publish the workbook to My Folders in IBM Cognos Connection:
- Save the workbook on your computer.
Tip: To save the workbook without data, right-click the report
and click Remove Data. You can refresh all
data later.
- From the IBM Cognos for Microsoft Office toolbar, click the publish
icon.
- In the Publish window, select
the IBM Cognos Business Intelligence server where
you want to save the report, and click Publish.
The workbook now appears in IBM Cognos Connection. To open a workbook from IBM Cognos Connection,
select it and save it locally to your computer.
What to do next
For information about working with IBM Cognos content in Microsoft Office,
see the IBM Cognos for Microsoft Office online help.