
Example - Monitor Performance
A metric is an indicator of key measures that compares actual results to targets. A metric also records who is responsible for the results and the impact of the metric. A scorecard is a collection of performance metrics and projects that reflects the strategic goals of a unit in an organization.
This exercise shows how to
- Review a strategy map for a visual representation of the strategy and the objectives of that strategy for an organization
- Review and understand the performance of a metric on a scorecard
- Create an action on a metric
- Add a metric to your watch list
You are a sales manager for a region for the Sample Outdoors Company. You regularly look at a scorecard that contains metrics about your sales area. The metrics give you an instant idea of how the current sales compare to the sales targets set by the company. Return quantity is one of the metrics.
To perform this exercise, you must have the appropriate licensing and security permissions for this functionality.
Things to notice:
- Metrics appear as either Poor (red), Average (yellow), or Excellent (green).
- For each metric, you can see whether the trend is improving, staying the same, or getting worse.
- When you move your pointer over the title of a metric, you see a history chart that shows the performance of the metric. A fly-out menu extends when you pause your pointer over a metric or a diagram.
Procedure
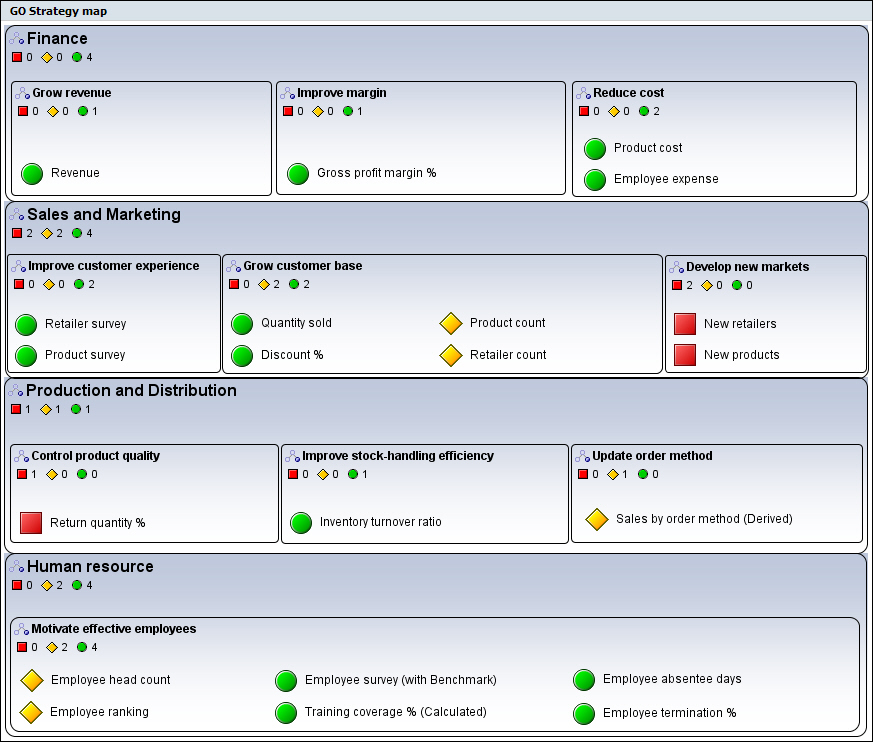
- View the strategy map:
- In the left pane, click the Scorecards tab, and click GO Consolidated.
- In the right pane, click the Diagrams tab.
In the GO Strategy map, notice how you can quickly evaluate the performance of each of the goals of the organization. The large indicators show the status for a specific strategy. The smaller indicators that appear below a strategy show the trend. The values for metrics that are not performing well appear in red. Status and trend indicators that appear in red indicate possible problem areas.
For example, in the Production and Distribution function of the strategy map, in the Control product quality metric, Return quantity % is red, which shows a poor performance metric.
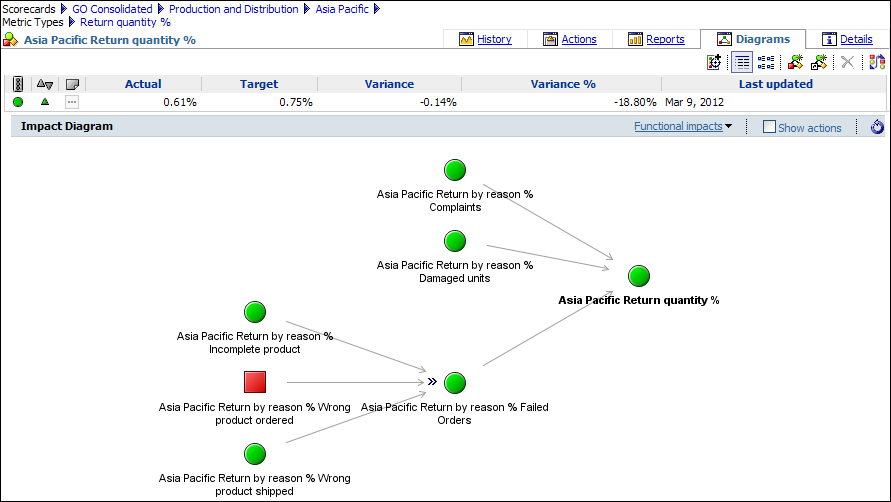
- Explore the scorecard:
- Expand the metrics in the diagram by clicking the arrow
next to the Asia Pacific Return by reason % Failed Orders metric.
You can see what data is in the Return quantity % metric. You can also see which return reason has a critical issue.
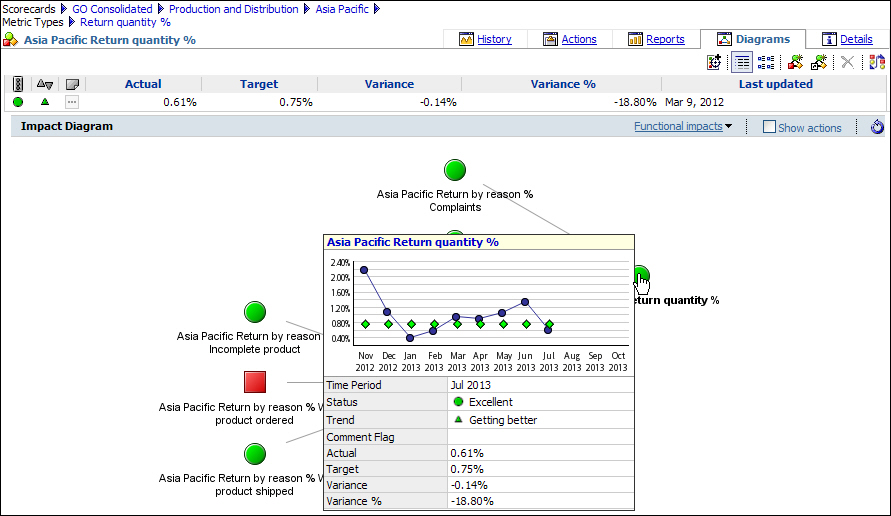
- Pause your pointer over Asia Pacific Return
quantity % to see more information about that metric.
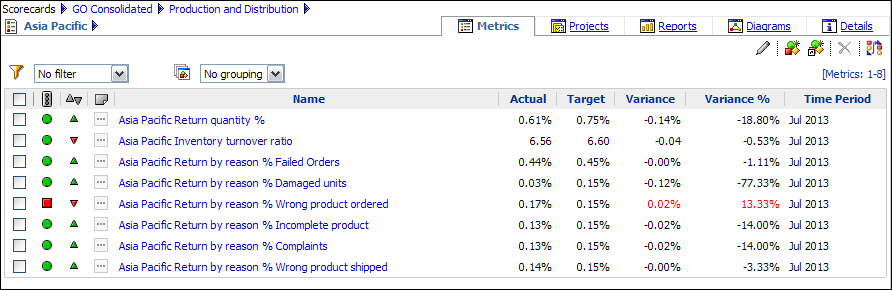
- In the left pane, under Production and Distribution, click Asia Pacific, and then click the Metrics tab to view the metric related to return quantity.
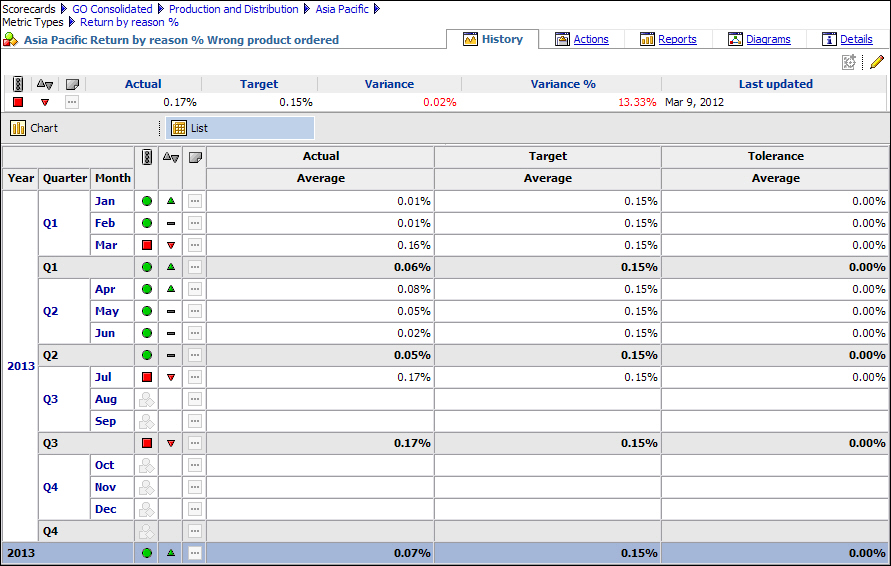
Notice that the status of Asia Pacific Return by reason % Wrong product ordered metric is poor.
- Expand the metrics in the diagram by clicking the arrow
next to the Asia Pacific Return by reason % Failed Orders metric.
- On the right pane, on the History tab, click List.
The information on the History tab answers the question "When?". You see the actual and target values for the metric data for previous periods. You also see quarterly and yearly summaries.
- Create an action for one of your business analysts to have
her investigate the performance of product returns:
- Click the Actions tab.
- Click New Action
 . Tip: You must select a metric
to see the New Action icon.
. Tip: You must select a metric
to see the New Action icon. - In the Name box, type Kazumi Uragome, the person who will own the action.
- To let Kazumi know what to do, in the Description box, type Please investigate.
- Beside the Planned Finish box, click the calendar icon, select a date one week from today. Tip: You may need to scroll down to see the Planned Finish box.
- Click OK.
- Add the Asia Pacific Return reason % Wrong product
ordered metric to your watch list so that you can easily
monitor it in the future:
- In the left pane, in the Production and Distribution scorecard, click Asia Pacific, and click the Metrics tab.
- Click the Asia Pacific Return reason % Wrong product ordered metric.
- On the upper toolbar, click Add to Watch List
 , and click OK.
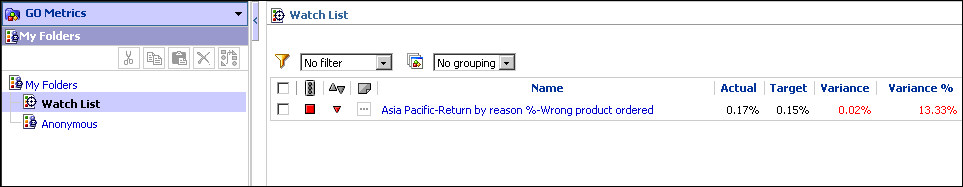
 - In the left pane, click My Folders and click Watch List.
The Asia Pacific Return by reason % Wrong product ordered metric appears in your watch list.
Example
- Add a comment to the metric to communicate information to users
of the metric.
Tip: Beside the metric, in the comment column, click the ellipsis (...) button. After you add a comment, a comment icon appears.
- Add an email notification so that you will be notified when the
metric changes.
Tip: Beside the metric, click the email alerts button. The email alerts button changes to show that email alerts is now turned on. You can also specify when and how often you receive email notification about changes to metrics in the watch list, by changing the email alerts properties.
- Filter the scorecard according to the status of the metrics.
Tip: On the Metrics tab, in the Filter box, select the status or trend that you want.
What to do next
For more information about using scorecards, see the Metric Studio online help.