
Example - Create a Report
In this exercise, you will learn how to:
- Create a chart
- Make the report interactive with prompts
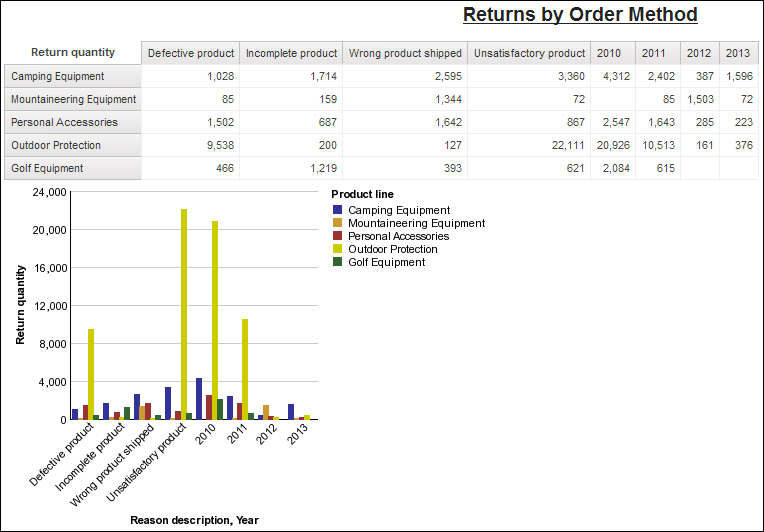
You are a business analyst for the Sample Outdoors Company. You create a chart report in Report Studio to show the performance of returns over the last few years. You make the report interactive by adding a prompt.
You will create a report that looks like the Report Studio sample Returns by Order Method - Prompted Chart in the GO Data Warehouse (analysis) sample package.
To perform this exercise, you must have the appropriate licensing and security permissions for this functionality.
Things to notice:
- When you use Report Studio, data is not live. You must run the report to view data.
- You can view the XML report specification.
- You can add multilingual capabilities.
Procedure
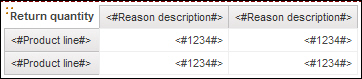
- Insert data in the crosstab zones:
- In the Source pane, expand Sales and Marketing (analysis), Returned items, Return reason, and Return reason. Drag Reason description to the Columns zone.
- Under Returned items, expand Returned items. Drag Return quantity to the Measures zone.
- Under Returned items, expand Products, and Products. Drag Product line to the Rows zone.
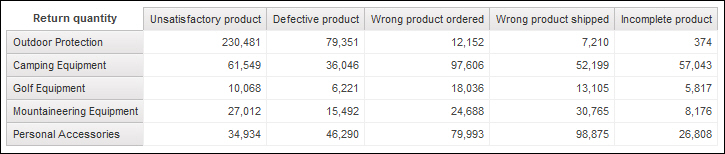
- Click Run Report
 to run your report and verify the content.
 The report output appears in IBM Cognos Viewer.
Tip: To return to Report Studio, close the IBM Cognos Viewer Web browser.
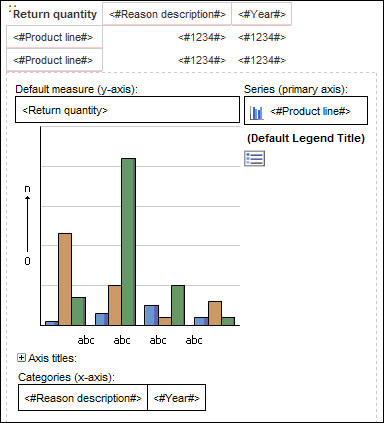
- Insert a chart in the report:
- In the Source pane, click the Toolbox tab.
- Drag the Chart object below the crosstab.
- When the Insert Chart window opens, click the Column chart type.
- Select Fill with data from and click OK. The data from the crosstab is automatically added to the chart.
- Click the chart to select it.
- In the Properties pane, under Data properties, select the Query property. Select Query1 from the list. Tip: When you change the Query property to the query that you used for the crosstab, it becomes easier to find and reuse the same data items for the chart.
- Create a filter to exclude the Wrong product
ordered return reason from the crosstab:
- In the crosstab, click the Reason description column heading.
- On the toolbar, click the arrow next to the Filter icon
 , and click Create Custom Filter.
 - Under Condition, select Do NOT show the following values.
- Under Values, select Wrong product ordered and move it to the Selected values list.
- Click OK.
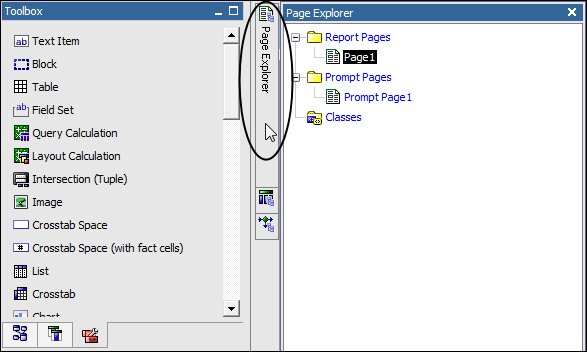
- Pause the pointer over the Page Explorer button
 on the Explorer bar. In Report Pages, click Page1 to return
to the report page.
on the Explorer bar. In Report Pages, click Page1 to return
to the report page. Tip: Click the Prompt Pages folder title to remove or rename a page, or to edit properties.
- Run your report and verify the content:
- Click the run report button.
- In the Order method drop-down list, click E-mail and then click Finish.
The report output appears in IBM Cognos Viewer.
Example
Try on your own:
- Save the report as a template so you can create reports with the
same layout and include different data.
Tip: From the File menu, click Convert to Template and then save the report with a new name.
- Change the chart background color.
Tip: In the work area, click the chart. In the Properties pane, expand Color & Background, click Background Color, and click the ellipsis (...) button next to Background Color.
- View the XML specification for the report.
Tip: From the Tools menu, click Show Specification.
What to do next
For information about using Report Studio, see the IBM Cognos Report Studio User Guide.