
Example - Create a Query
Use IBM® Cognos® Query Studio to retrieve
information from a relational data source when you want to create
reports that answer simple business questions. Also use Query Studio
to publish reports for audiences who do not require complex layout
or formatting.
In this exercise, you will learn how to
- Add columns
- Add calculations
- Add conditional formatting
- Apply a template to the report
- Save the report
You are a business analyst for the Sample Outdoors Company. You want to create a report that shows which products have the highest return rate and how much revenue was lost from product returns.
To perform this exercise, you must have the appropriate licensing and security permissions.
Things to notice:
- Data that you can add to the report has a different icon depending on the data type.
- The reports that you create in Query Studio can be viewed and edited in IBM Cognos Report Studio.
Procedure
- Create a calculation to show the lost revenue (Return
quantity * Unit cost = Lost
revenue):
- Select the column headings that you want for the calculation. In the work area, click the heading for Return quantity and Ctrl+click the heading for the Unit cost column.
- Click Calculate
 .
. - In the Operation box, select * (multiplication).
- In the New item name box, type Lost revenue.
- Click Insert.
- Delete the Unit cost column.
- Format the calculated column that you added:
- Right-click the heading for the Lost revenue column and click Format Data.
- In the Category list, click Currency.
- In the Thousands separator list, click Yes, and then click OK.
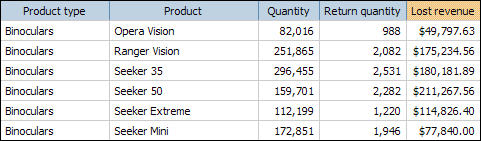
- Create a calculation to show the percentage of returns
(Return quantity / Quantity)*100):
- In the work area, click the heading for the Return quantity column, and Ctrl+click the heading for the Quantity column.
- Click Calculate .
- In the Operation type box, select Percentage.
- The content of the Operation box changes to percent (%).
- In the New item name box, type % Returned.
- Click Insert.
- Apply conditional formatting to highlight products with
a lost revenue greater than $200,000:
- Click the heading for the Lost revenue column.
- From the Menu, click Change Layout, and click Define Conditional Styles.
- In the New value: box, type 200000, and click Insert.
- For the first range, in the Style column, select Poor, and click OK.
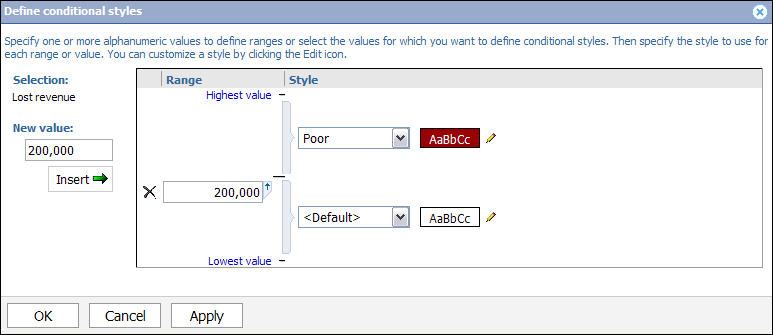
The cells with a lost revenue greater than $200,000 appear with a red background.
- Save the report:
- From the toolbar, click Save.
- In the Name box, type Returns by Product Type.
- Accept the default save location, and click OK.
The final report looks like this:
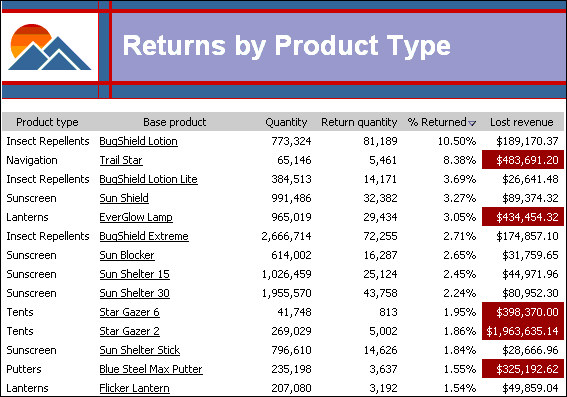
Notice that the Star Gazer 2 tent has the highest lost revenue rate.
Example
Try on your own:
- Every time you modify a report, Query Studio updates the results
by running a query. Use the run options to preview the report with
no data. From the Run Report menu, click Preview
with No Data.
Tip: To preview a report with limited data, you must define design filters in the model.
- Review the definition of all report items in the report. From the Manage File menu, click Report Definition. This is useful for troubleshooting a report.
What to do next
For information about using Query Studio, see the Query Studio online help.