
Example - Run a Report
In this exercise, you will learn how to
- Navigate the portal
- Run a report
- Navigate within a report
- Drill through from one report to another
- View the report in a different format
You are a business analyst for the Sample Outdoors Company. You are asked to study the percentage of returned products. Returned items reveal important information about the quality of products, especially products that are returned because they are defective or are missing parts.
You will drill down to more detailed information in the pie chart, drill back up to the beginning, then drill through to another report using the data shown in your current report as a filter.
Things to notice:
- The icon for a report shows the default format and default action of the report.
- Reports that have saved outputs have an additional icon in the Actions column.
- At any time, you can click the arrow next to the help button, and click Go to the Welcome Page to return to the IBM Cognos Welcome page.
Procedure
- Under Actions, click the Run with
Options icon
 next to the report, accept the defaults, and then click Run.
 The report runs and opens with the latest data about product returns.
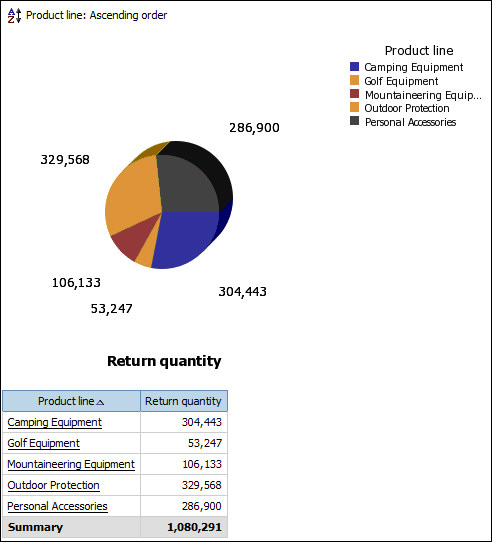
You notice that Outdoor Protection products have the highest number of returns. You want to drill down to obtain more detailed information.
Example
Use IBM Cognos Connection to try the following report features:
- On the toolbar, click the Home or Return icon to return to the portal.
- Change the report format to PDF. Tip: Click Run with Options on the actions toolbar. From the Format list, select PDF, and click Run.
- Change the report to a different language. To do so, change the
language settings in IBM Cognos Connection or in your
Web browser, and then run the report again. Because the sample data
is multilingual, all data will be translated.Tip: Click My Area Options
 , My Preferences. Under Regional options, change the Product language and the Content language. To see the content
language changes, you must run the report.
, My Preferences. Under Regional options, change the Product language and the Content language. To see the content
language changes, you must run the report.
What to do next
For more information about running reports, see the online help in IBM Cognos Connection.