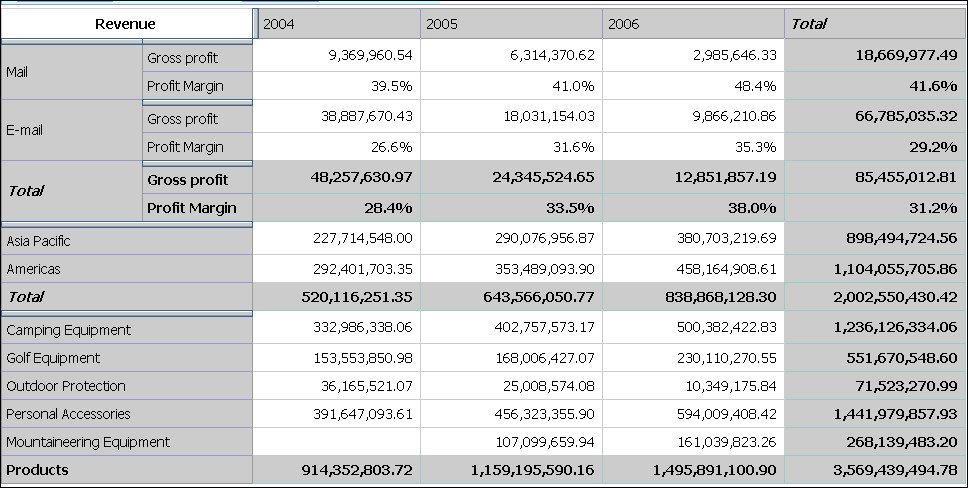
Example - Create an Asymmetrical Crosstab
In this topic, you learn how to create asymmetrical
crosstab layouts to view several kinds of data in a single crosstab.
You want answers to these questions:
- How much are the gross profit and profit margin for two specific order methods?
- How much is the revenue for all products?
- How much revenue was generated by two specific markets?
If you need more help, see Inserting Items and Insert Sets of Items in Complex Layouts.
Procedure
- Right-click the selected names and, from the Insert menu,
click Above Selected Set.
Your analysis will look like this.