The Report Studio Map Object
Maps are similar to crosstabs in the way their data is organized. The display is different, but maps show the intersection of data the same ways as crosstabs; for example, you can see the revenue for golf equipment in Canada.
A map in IBM® Cognos® Business Intelligence consists of a collection of layers. Each layer contains different information and acts like a transparency that is placed on top of the map. Each layer adds more information to the map. For example a map of the world may contain information related to countries or regions on one layer and information related to cities on another level.
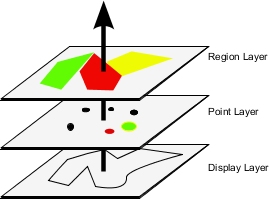
IBM Cognos Report Studio maps provide the following three types of layers:
- Region layer
Specifies the regions on a map to be differentiated according to values in the data source. For example, to show the revenue level for each country and region on a map of the world, choose Country and Region as the region layer and then specify that the color of each country and region is based on the revenue value for that country and region. Areas can be set up for drilling through to other reports.
- Point layer
Specifies the points to be placed on a map. The color and size of the points is based on the data that you select. For example, you choose to show cities as points on a map and set the color of each point by revenue and the size of each point by profit. Points can be set up for drilling through to other reports.
- Display layer
You can show or hide items such as grid lines or capital cities. This layer is determined in the map file and not in the data source.
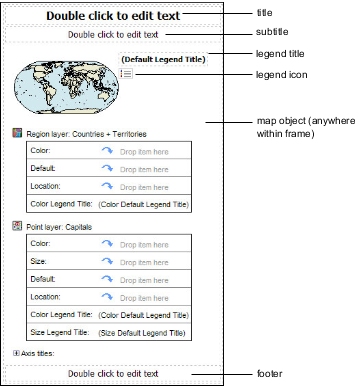
Parts of Map Reports
The following shows the parts of a map as they appear in the IBM Cognos Report Studio interface.