Example - Create a Discontinuous Crosstab
You are a report author at The Sample Outdoors
Company, which sells sporting equipment. You are requested to create
a report showing sales for each product line by quarter and by order
method. Since the report will have columns with data from different
dimensions, you create a discontinuous crosstab report. Discontinuous
crosstabs are also known as disconnected or disjoint crosstabs or
crosstabs with unrelated columns.
Procedure
- From the Source tab
 :
: - Expand Sales and Marketing (query) and Sales (query).
- Expand Product and drag Product line to the Rows area.
- Expand Order method and drag Order method to the Columns area.
- Expand Sales fact and drag Revenue to the Measures area.
- Click the sort order button
 to sort in ascending order and click OK.
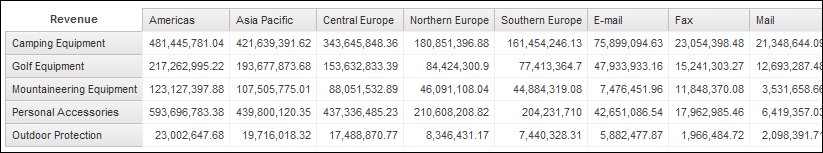
Results
Figure 1. Crosstab showing revenue by product line by region