Charts are rendered as images in report outputs,
such as HTML and PDF. As a result, they are difficult to navigate
for visually impaired users and screen readers cannot convey the information
shown in charts. To make your reports accessible, you can add a conditional
layout that shows list or crosstab equivalents of the chart when the
accessibility features are enabled for the report output.
To
set up this conditional layout, use a conditional block that contains
the list or crosstab and the report function IsAccessible.
The IsAccessible function is a Boolean function
that returns Yes (or true) when the accessibility
features are enabled for the report output and No (or
false) when the accessibility features are not enabled.
Therefore,
the list or crosstab becomes conditional and appears only when the
accessible report output option is enabled. In addition, you should
add alternate text for the chart object so that screen readers can
let users know that an accessible list or crosstab follows.
Procedure
- Open IBM® Cognos® Report Studio with the
sample GO Sales (query) package.
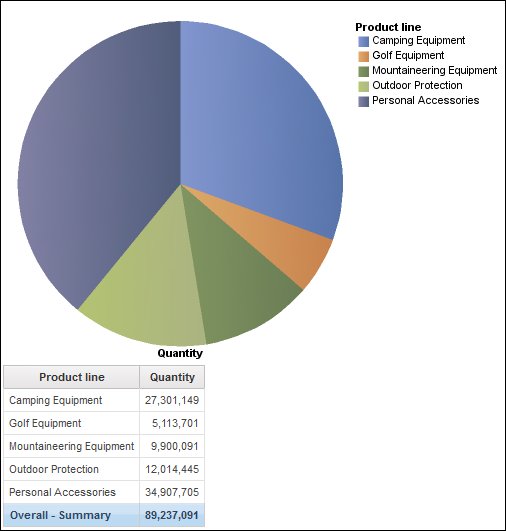
- Create a new report with a pie chart.
- Add data items to the chart. From the Source tab
 , do the following:
 - Expand Sales (query) and Sales and then insert Quantity in the Default measure area.
- Expand Products and insert Product line in the Series (Pie Slices) area.
- Run the report to see your chart.
- Add alternate text for the pie chart:
- Select the chart and, in the Properties pane,
double-click the Alternate Text property.
- Select Specified text and click the ellipsis button.
- Type default text for the chart, such as
A pie chart shows the quantity of sales by product line as a percentage of total sales. An equivalent list is below.
If you want to add the alternate text in additional languages, click the add button  .
.
- From the Toolbox tab
 , insert a Conditional Blocks object below the chart.
- Select the conditional block and, from the Properties pane,
double-click the Block Variable property.
- Under Variable, select New
boolean variable and type a name for the variable, such
as accessibility_condition.
- In the Report Expression dialog
box, specify the expression that defines the variable:
- From the Functions tab
 , expand Report Functions and insert the IsAccessible function to the Expression Definition box.
- Type a closing bracket at the end of the function IsAccessible
() and click OK.
- Select the conditional block and in the Properties pane,
change the Current Block property to Yes.
- From the Toolbox tab, add a list inside the conditional block.
- Add the same data items from the chart to the list. From the Source tab, do the following:
- Expand Sales (query) and Products and insert Product line in the list.
- Expand Sales and insert Quantity as the second column in the list.
- Add summary text for the list
- Select the list and in the Properties pane,
double-click the Summary Text property.
- Select Specified text and click the ellipsis button.
- Type default text for the list, such as
The first column lists all product lines and the second column lists sales quantities.
If you want to add the alternate text in additional languages, click the add button.
- Select the conditional block and in the Properties pane,
change the Current Block property to No.
- From the Run menu, click Run
Options and select the Include accessibility
features check box.
- Run the report.
Results
Because we just chose to include the accessibility features,
you see both the chart and the list. Also, when a screen reader encounters
the image for the chart, it reads the alternate text that you added.
If
you clear the Include accessibility features check
box and run the report again, you see only the chart.
Figure 1. Report showing both a pie chart and a list