
The user interface
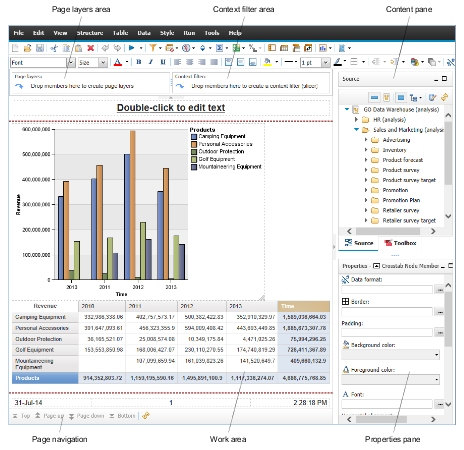
The following figure shows the Cognos Workspace Advanced user interface.
Use a screen resolution of at least 1024 by 768 pixels.
User interface profiles
A user interface profile might be set for you by an IBM Cognos Business Intelligence administrator. Users with different profiles see different interfaces and experience different default behavior. If you are able to use more than one profile, you are prompted to choose a profile when you start Cognos Workspace Advanced.
For more information about profiles, see your Cognos BI administrator or the IBM Cognos Business Intelligence Administration and Security Guide.
The work area
The work area is where you create your report.
By default, you see live data as you create your report. You can switch to design mode where you see only placeholder data. For more information, see Work in Preview or Design Mode.
Content pane
The content pane contains objects that you can add to a report. You add objects to a report by dragging them to the work area.
You cannot reposition the pane when you open a widget from a workspace in IBM Cognos Workspace to edit it in Cognos Workspace Advanced.
Source tab
The Source tab  of the content
pane contains items from the package that is selected for your report,
such as data items and calculations. The source tree presents a dimensional
view of your data, which is organized into dimensions, hierarchies,
levels, and measures. For more information, see Exploring Dimensional Data.
of the content
pane contains items from the package that is selected for your report,
such as data items and calculations. The source tree presents a dimensional
view of your data, which is organized into dimensions, hierarchies,
levels, and measures. For more information, see Exploring Dimensional Data.
By default, the maximum number of items that are shown in the source tree is 50. Your administrator can set a different value for optimum performance, depending on the size of the data source.
For more information about inserting items from the source tree into your report, see Add Data to a Report.
Toolbox tab
The Toolbox tab  of the content
pane contains various objects, such as text and graphics, that you
can add to your report.
of the content
pane contains various objects, such as text and graphics, that you
can add to your report.
For more information about inserting objects from the Toolbox tab into your report, see Insert Other Objects.
Search tab
The Search tab  of the content
pane contains the results when you search for members. You can insert
the members that are found in a search directly into a report.
of the content
pane contains the results when you search for members. You can insert
the members that are found in a search directly into a report.
For more information, see Search for a Member.
Properties pane
The Properties pane shows the formatting for an object in a report. You can change the formatting properties by using either the toolbar or the Properties pane. If you prefer to use the Properties pane, you can click Hide Style Toolbar to hide the toolbar icons that control object formatting.
You cannot reposition the pane when you open a widget from a workspace in Cognos Workspace to edit it in Cognos Workspace Advanced.
Page layers area
Use the Page layers area
to create sections, or page breaks, in a report to show values for
each member on a separate page. For example, you can drag Northern
Europe sales territory from the Source tab to the Page
layers area. The report is broken into a separate page
for each territory within northern Europe. Each page's context appears
in the report header.
For more information, see Create Page Layers.
Context filter area
Use the Context filter area
to filter your report to show values, or context, only for a specific
data item. This technique is also known as a slicer filter. For example,
you can drag Sales Territory from the Source tab to the Context
filter area. When you click a specific territory from
the list, the values in the crosstab change to represent data for
that territory.
For more information, see Creating a context filter.