
Working with Crosstab Reports
Crosstabs are dimensional objects that have row edges and column edges. Each edge is composed of a set of crosstab nodes. Each crosstab node contains the following:
- One or more crosstab node members.
- Zero or one nested crosstab node, which contains one or more crosstab node members or nested crosstab nodes.
Each crosstab node member refers to a data item that contains an expression that defines the members that appear in the crosstab.
The following crosstab contains four crosstab nodes.
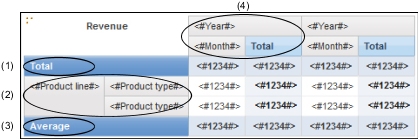
1 Crosstab node 1 contains a single node member for the total. This node refers to the data item Total(Product line).
2 Crosstab node 2 contains a crosstab node member that refers to the data item Product line. This member has a nested crosstab node containing a crosstab node member that refers to the data item Product type.
3 Crosstab node 3 contains a single node member for the average. This node refers to the data item Average(Product line).
4 Crosstab node 4 contains a crosstab node member that refers to the data item Order year. This member has two nested crosstab nodes. The first node contains a crosstab node member that refers to the data item Order month. The second node contains a crosstab node member for the total. This node refers to the data item Total(Order month).
Crosstab nodes can be placed anywhere in the crosstab. For example, in the previous diagram, you can drag Order month under Average to create a row edge.