Crosstabs
Use crosstab reports, also known as matrix reports,
to show the relationships between three or more query items. Crosstab
reports show data in rows and columns with information summarized
at the intersection points.
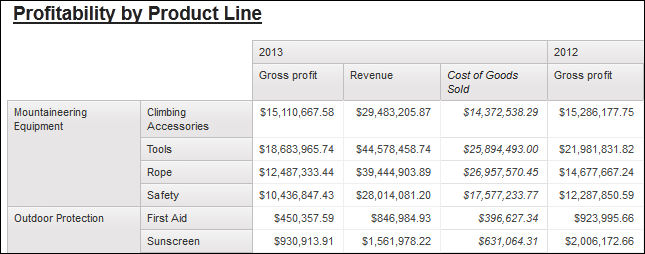
For example, the following example crosstab report shows the gross profit and revenue by product line for each year.
Figure 1. An example crosstab report