
Radar Charts
Radar charts integrate multiple axes into a
single radial figure. For each figure, data is plotted along a separate
axis that starts at the center of the chart.
The following example shows the revenue from multiple retailer types in multiple territories.
Figure 1. An example radar chart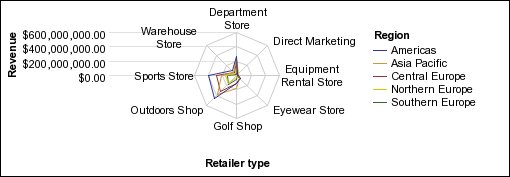
Radar charts can plot data using standard and stacked configurations.