
Bar Charts
Bar charts are useful for showing trends over
time and for plotting many data series.
Bar charts use horizontal data markers to compare individual values.
The following example shows revenue for every country or region.
Figure 1. An example bar chart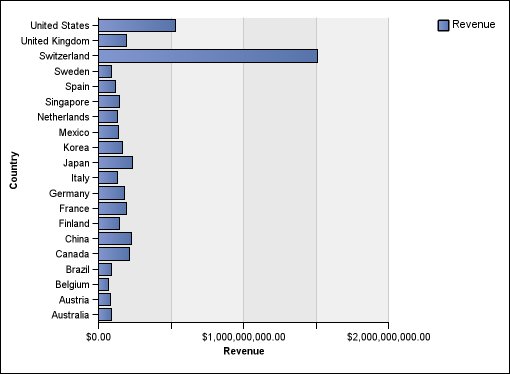
Bar charts can plot data using standard, stacked, and 100 percent stacked configurations.