
Area Charts
Area charts are useful for emphasizing the magnitude
of change over time. Stacked area charts are also used to show the
relationship of parts to the whole.
Area charts are like line charts, but the areas below the lines are filled with colors or patterns.
Do not use standard area charts to show multiple data series because it is possible for areas with lower values to be covered by others. For multiple data series, use a stacked area chart.
The following example is a stacked area chart that shows the quantity of products that were sold over a four-year period in multiple territories.
Figure 1. An example area chart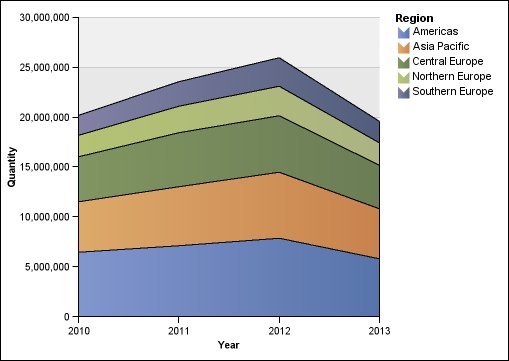
Area charts can plot data using standard, stacked, 100 percent stacked, and three-dimensional configurations.